Standard reference


|
temperature effect

Results


Discussion
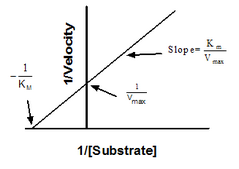
The results collected was inaccurate. The value of 1/V should be decreasing as the concentration increases. Unfortunately. our results shows an increasing trend as the substrate increases. Thus the graph of Lineweaver Burk Plot cannot be plotted for this experiment. However, according to the theory, amylase works best at human body temperature, which is at 28°C. Therefore, if the results is accurate, the Km for 28°C will be the highest. Km is the Michaelis-Menten constant, which represent the substrate concentration that causes the enzyme activity to work at half of its maximum value. Km is chosen to be determined rather than the maximum velocity. This is because according to the Michaelis-Menten graph, the maximum velocity approaches an asymptote, which is quite difficult to be determined. Therefore, a better way to compare the velocity of enzyme reaction is to determined half of the enzyme velocity.
The results collected was inaccurate. The value of 1/V should be decreasing as the concentration increases. Unfortunately. our results shows an increasing trend as the substrate increases. Thus the graph of Lineweaver Burk Plot cannot be plotted for this experiment. However, according to the theory, amylase works best at human body temperature, which is at 28°C. Therefore, if the results is accurate, the Km for 28°C will be the highest. Km is the Michaelis-Menten constant, which represent the substrate concentration that causes the enzyme activity to work at half of its maximum value. Km is chosen to be determined rather than the maximum velocity. This is because according to the Michaelis-Menten graph, the maximum velocity approaches an asymptote, which is quite difficult to be determined. Therefore, a better way to compare the velocity of enzyme reaction is to determined half of the enzyme velocity.

Michaelis-Menten Graph
|
As the Lineweaver Burk plot cannot be plotted the exact value for Km and Vmax cannot be determined. According to the general graph, the Vmax can be determine by the y-intercept of the graph. The y-intercept represent 1/Vmax. The Km also can be detrmined by the x-intercept of the graph because the x-intercept represents -1/Km.
|
|
In fact. we have to carry out another experiment to test the effect of substrate concentration on the rate of enzyme reaction. The experiment results is as follow:

There are no data collected from the group that carried out this experiment. This experiment is divided into parts so that the whole class can share the results. Unfortunately, we are unable to collect the full results for this experiment. In this experiment, our group is responsible for the standard curve and to produce the equation fot the standard line. The standard curve has to be plotted so that other experiments can refer to when determining the actual concentration of starch.
